

In June 2021, the Capitol Corridor administered a survey* to passengers on board our trains. We do an on-board survey every year in the spring, except in 2020 due to COVID. The purpose of the survey is to learn more about our customers, including how they use the service, demographics, and overall satisfaction.
Because of the unprecedented challenges we faced this past year, marked by the temporary reduction in service and the decrease in ridership, we were not sure what to expect from the survey. Despite fewer people riding the train, we were very pleased to have 1,079 passengers participate. If you were one of those participants, thank you for your contribution!
Having now analyzed the survey results, we discovered that some things haven’t changed too much – such as station usage and basic rider demographics. We also had some pleasant surprises and interesting findings.
You can find a complete summary of the survey results on our website. Following are five key takeaways.
We Continue to Attract New Riders
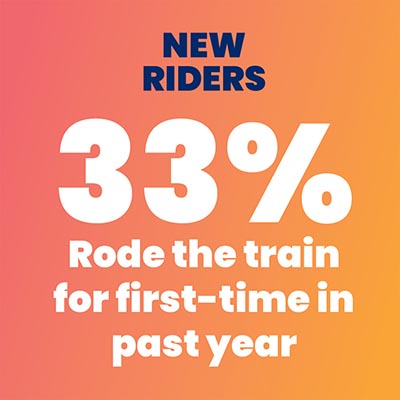 In the years leading up to the pandemic, we noticed a trend of more and more new riders. In the 2019 survey, 43% of respondents had been riding the Capitol Corridor train for one year or less. Not surprisingly, that percentage of new riders was lower in 2021, but it was still higher than expected, at 35%. That means even in the midst of a global pandemic, one-third of our customers started using our service for the first time. We haven’t dug into the reasons behind this yet, but we suspect it may be related to people moving outside the San Francisco Bay Area to Sacramento and communities further east. We are thrilled to see people continuing to discover and start riding the Capitol Corridor!
-
Customer Satisfaction Remains High
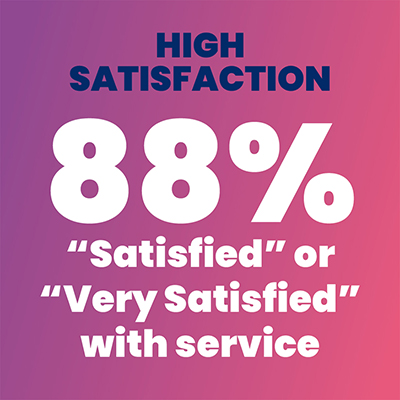
 This is the best news that came out of our 2021 on-board survey. Eighty-eight percent (88%) of respondents reported their level of satisfaction as “High” or “Very High”, with 55% in the “Very High” category. This is the highest level of satisfaction we’ve had (by two percentage points) since 2016! While we know our reduction in service meant that our schedule no longer worked for everyone, we were very happy to see that those who have been using the Capitol Corridor over this past year have been very satisfied. To top it off, a whopping 94% said they are “Likely” or “Very Likely” to recommend the Capitol Corridor to a friend. Thank you to everyone who has told a friend or family member to ride the train; we appreciate your loyalty!
People Aren’t Riding as Frequently
As we expected, compared to pre-pandemic patterns, a greater share of our customers is riding the train less frequently. Only 19% of respondents say they ride the Capitol Corridor five days a week or more, compared to 28% in our 2019 survey, and the average weekly ridership is down a day from three to two. We are also seeing decreased multi-ride ticket usage as a share of all tickets, with 18% using a monthly ticket, for example, compared to 32% in 2019. It will be interesting to see if and how these numbers change in the coming months as more people head back to the office, but with remote and hybrid work options more prevalent.
-
The Majority of Riders Choose the Train Over Other Travel Options
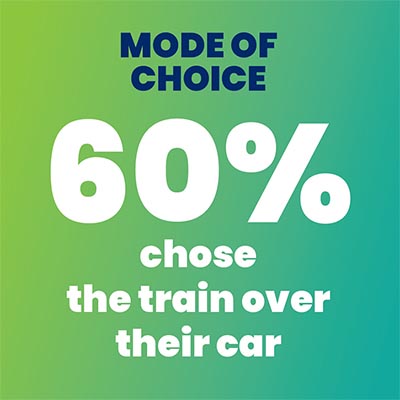
We know our riders have other ways to get where they need to go, but it was nice to see that the majority of these “choice riders” chose the Capitol Corridor train over driving. In fact, nearly two-thirds (60%) of respondents reported that if not for the train they would otherwise use a vehicle for their trip. This number demonstrates that the Capitol Corridor helps reduce greenhouse gases by decreasing the total number of auto trips that would have otherwise been made.
Sacramento Remains Our Top Station
As mentioned above, there were some things that didn’t change too much from pre-pandemic to today, including overall station usage. As in past years, Sacramento is our most-used origin station (28%), as well as the most popular destination station (27%). Most of our riders also live in Sacramento (27%), followed by Alameda (14%), and Yolo (13%) to round out the top three.
See complete survey results here.
*The survey was conducted by the independent firm, Corey, Canapary & Galanis, and was made available in English, Spanish and Chinese.