Ever wondered which Capitol Corridor trains are the most crowded, or have the most reliable on-time performance? This is the kind of information we keep track of every day, and we know others are interested in these important service performance measures.
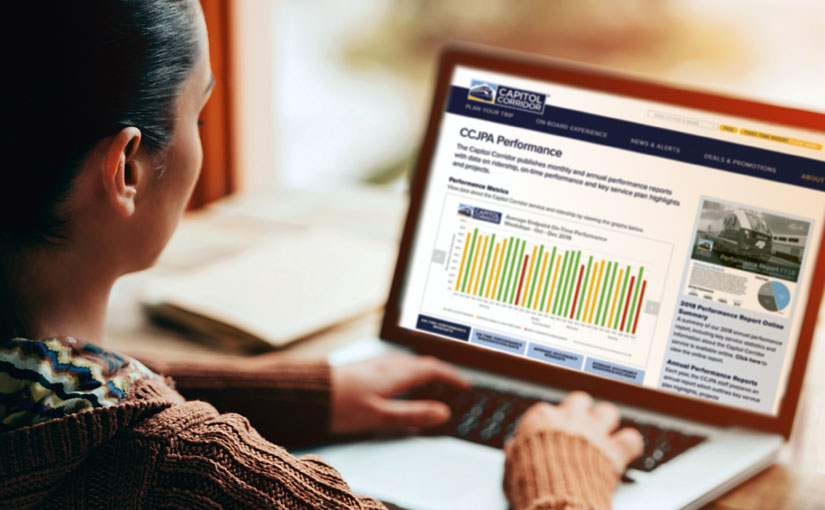
For that reason, we’ve turned some of that data into easy-to-read graphs and added them to the Performance page of the Capitol Corridor website. You’ll be able to quickly see which trains (weekday and weekend) have the highest on-time performance and what the average seat occupancy is for each train. We will update these graphs every three months to keep the information relevant and useful.
The enhanced Performance page, now live on the Capitol Corridor website, also includes a link to the CCJPA’s newly released Annual Performance Report for FY 2018 (October 1, 2017 through September 31, 2018). Full of engaging infographics and images, the report provides a snapshot of the Capitol Corridor’s past-year successes and ongoing commitment to safety, service, and innovation. Highlights include:
- Launch of critical, federally mandated safety system,
- record-breaking ridership and revenue,
- stellar on-time performance (with room for improvement still!),
- expansion of service with the new Hannigan Fairfield-Vacaville Station,
- more riders walking, biking, or taking transit to stations, and
- engaging rider campaigns and promotions.
Check out the new page, along with the Performance Report here.